
The revenue stage proved that your business model can sustain itself. The scale stage asks a harder question: does the model still work once the market gets involved? This is the fifth and final stage of lean analytics, and it tests something the earlier stages cannot — whether the strengths you built at small scale survive when channel dynamics, competitor responses, and operational load all push back at once.
Scale is not a victory lap. It is the stage where most business assumptions break. A product that delights a thousand users can stall at ten thousand. A pricing model that worked in one segment can collapse in the next. The companies that survive this stage treat scale as a separate experiment, not a continuation of the previous one.
What the Scale Stage Really Tests: Market Viability
The scale stage validates market viability, not product viability. By the time you arrive here, the product question is already answered. What remains is whether the market structure around your product supports a durable position.
Three things should already be in place before you enter this stage:
- Strong stickiness (users keep coming back)
- A proven revenue mechanism
- Acceptable unit economics
Scale tests whether these strengths hold up under pressure. The earlier stages each answered a single question:
- Empathy — The problem exists.
- Stickiness — Users keep returning.
- Virality — Value spreads.
- Revenue — You can make money sustainably.
Scale asks something different: does the surrounding market structure support a long-term advantage? That covers channel dynamics, competitor responses, operational load, and how costs behave at volume. Many products fail at this stage not because the idea was wrong, but because growth exposed weaknesses that were invisible at smaller scale.
Scale Is Not Just More Users: Repeatability, Predictability, Resilience
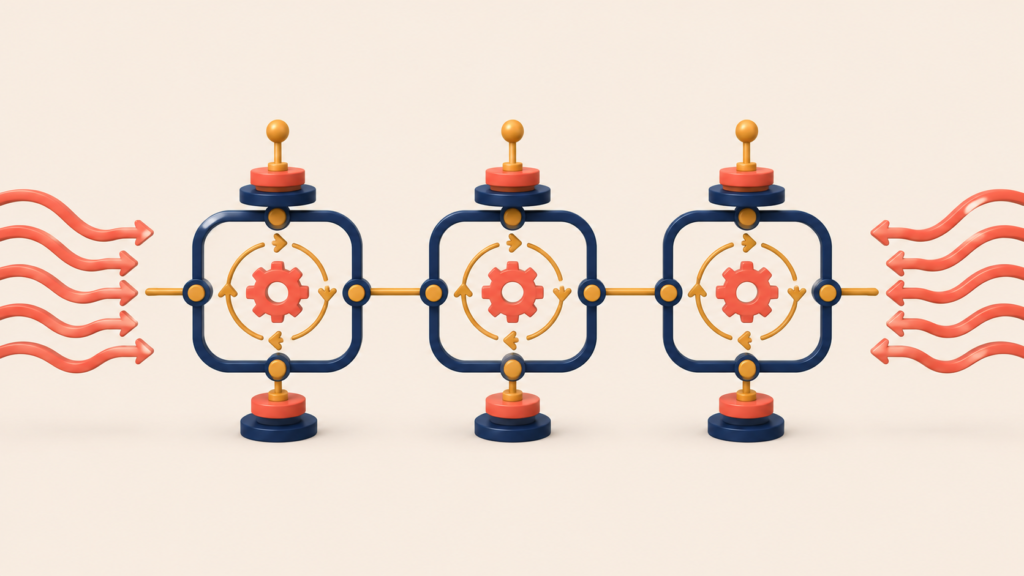
Scale is often confused with simple expansion. More customers, more regions, more features. That definition is misleading because it treats growth as the goal rather than as a test of structural strength.
In lean analytics, scale means three specific things:
- Repeatability: What worked once keeps working.
- Predictability: The economics stay stable.
- Resilience: The system absorbs growth without breaking.
If growth adds chaos faster than it adds value, you are not scaling. You are stretching. Growth that weakens your core metrics is not progress. It is chaos debt accumulating on the business.
Porter’s Strategic Framework: Avoiding the “Stuck in the Middle” Trap
Strategy becomes concrete at this stage, and Michael Porter’s view of strategy starts to feel practical rather than academic. In his earlier work on competitive strategy, Porter identified three generic ways to win at scale:
- Segmentation: Win by focusing on a niche.
- Cost leadership: Win through efficiency.
- Differentiation: Win through uniqueness.
The most dangerous position is none of the above. A company stuck in the middle shows familiar symptoms:
- No pricing power.
- No cost advantage.
- Unclear positioning.
- A roadmap driven by competitors instead of by customers.
This is what Porter called being “stuck in the middle”:
- Too big to be a niche.
- Too small to be efficient.
- Too generic to be differentiated.
At scale, the market punishes this position faster than any earlier stage does. Teams here can experience failure more quickly than they did in stickiness or revenue.
Two Critical Signals: Market Pull and Payback Period
At scale, the question shifts. You are no longer asking “do users like this?” You are asking whether the market is pulling the business forward, and whether you can sustain the pull. Two signals matter together: market pull and payback period.
Market pull is not press coverage. It is every signal that the market is investing energy in your business:
- Partners reaching out first (a distribution pull).
- Ecosystem activity (integrations, templates, community reuse).
- Higher-quality inbound leads (a demand pull).
- Competitor responses (a validation that you are in the game).
Pull can also become noise. Competitor moves and loud inbound requests can hijack the roadmap and produce three predictable failures:
- Roadmap stagnation: The team loses initiative, reacts to the market, and slows innovation.
- Diluted positioning: Trying to serve every segment that shows up ends up serving none of them.
- Core workflow erosion: The user experience degrades as exception cases accumulate.
Pull tells you where the market is looking. It does not automatically tell you where to go.
Payback period is what keeps the pull grounded. Customer acquisition payback is the time it takes to earn back what you spent acquiring a customer. It matters at scale because it compresses several realities into a single number:
- Channel efficiency: Are you buying growth at a good price?
- Operational friction: How much hidden human effort hides in “closing” and “onboarding”?
- Market constraints: Sales cycles, compliance, procurement — especially in B2B.
When the payback period stretches, the company changes shape:
- Growth becomes capital intensive.
- Experimentation slows because mistakes cost more.
- Teams turn reactive and defensive.
A short payback period buys patience and room to experiment. A long one quietly takes both away.
Standardization vs Market Expansion: Two Different Scaling Modes
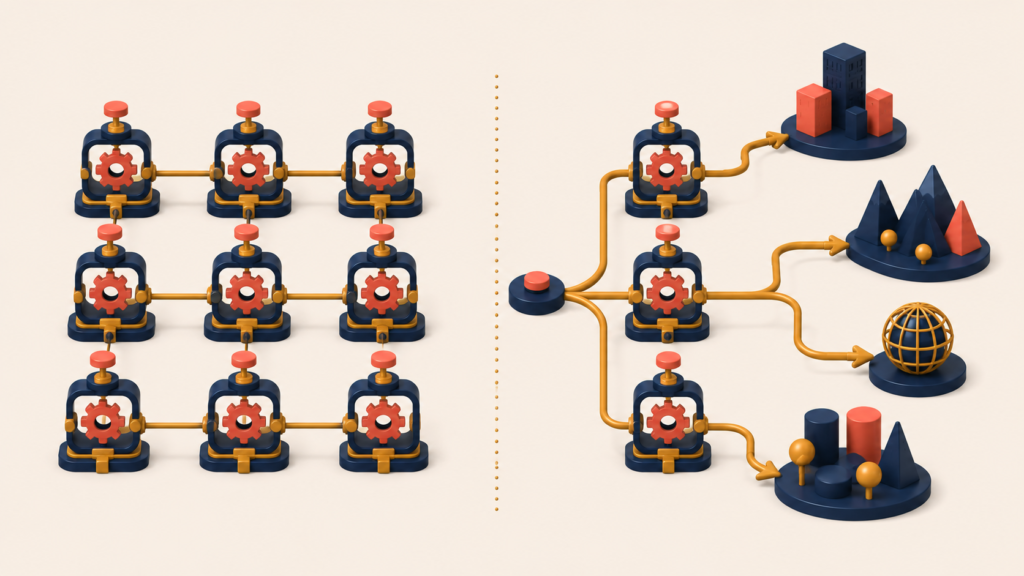
Most scaling efforts fall into one of two fundamentally different modes. The mistake many teams make is treating them as interchangeable. They are not.
Standardization: Doing the same thing with less effort
Standardization is not about adding growth surface. It is about removing variance. You are scaling how efficiently you serve customers you already understand. The typical pattern:
- The same customer type.
- The same core problem.
- The same value proposition.
- Less human involvement per unit of revenue.
Common examples:
- Automating onboarding and configuration.
- Replacing sales or support stages with self-serve flows.
- Simplifying setup and edge cases.
The goal is not more revenue immediately. The goal is similar revenue at a lower marginal cost, which buys you:
- More predictable economics.
- More room for experimentation.
- Less operational fragility.
Standardization is invisible from the outside, but it is what makes scale survivable.
Market Expansion: Trying something new in a new context
Market expansion tests whether the product and model still work in environments you do not yet fully understand. Typical expansion shapes:
- SMB → mid-market or enterprise.
- One region → another region.
- Direct sales → partners or resellers.
- Unregulated environment → regulated environment.
Expansion adds new variables to the business:
- New buyer dynamics.
- New constraints.
- New costs (sales, legal, support, compliance).
The goal here is not growth at any cost. It is finding new ways to grow that preserve unit economics.
Why this distinction matters. Standardization strengthens the core of the business. Market expansion stresses it. Expanding before the core is standardized creates problems:
- Manual work explodes.
- Exceptions become routine.
- Unit economics quietly degrade.
The most common failure pattern in scaling a startup is this: expanding into a new market to solve efficiency problems in the existing one. That almost always makes things worse. Standardization earns the right to expand. Expansion without standardization creates complexity that kills the growth engine.
Why Disciplined Experimentation Matters at Scale
As a company grows, the consequences of every decision compound:
- Experiments touch more users.
- Misalignments burn more cash.
- Recovery takes longer.
This is why unstructured experimentation becomes dangerous at scale. Earlier stages rewarded exploration and speed. At scale, the problem is no longer learning fast — it is learning deliberately. Without discipline, teams fall into familiar traps:
- Reacting to every signal.
- Pivoting on incomplete data.
- Mistaking activity for progress.
This is not agility. It is loss of control disguised as momentum.
Discipline at scale does not mean moving slowly. It means constraining choices so that learning stays intentional. A simple operating rule that many teams adopt:
- Three hypotheses.
- Three strategic bets.
- Three experiments per cycle.
This forces prioritization, makes trade-offs explicit, and keeps the whole organization focused on what matters right now. The cap is the point. Without it, the team takes on too many experiments and learns from none of them clearly.
The real danger at scale is the lazy pivot — changing direction without closing the loop on what was learned before. Frequent pivots at this stage do not signal flexibility. They signal a lack of conviction. A scale-stage team that pivots constantly is usually one that never finished its previous learning cycle.
Conclusion
The scale stage is not where you push harder on what already works. It is where you test whether what works at small scale still holds when the market pushes back. Repeatability, predictability, and resilience are the three properties that separate scaling from stretching. Market pull and payback period are the two signals that tell you whether the market is carrying you forward or wearing you down. Standardization earns the right to expand. And disciplined experimentation — three hypotheses, three bets, three experiments — is how you keep learning intentional when every decision now touches the whole business.
The next article in this series ties all five stages together with a diagnostic checklist for lean analytics — a single tool you can use to find which stage your business actually sits in, regardless of which stage you think it sits in.
Lean Analytics Series
(1) What is Lean Analytics? The Real Meaning of Lean and Why Experimentation Is at Its Core
(2) Lean Analytics Empathy Stage: How to Find Real Market Problems Worth Solving
(3) Lean Analytics Stickiness Stage: Measuring Retention and Engagement
(4) Viral Growth in Lean Analytics: How Users Bring Other Users (Coefficient, Cycle Time, B2B)
(5) Lean Analytics Revenue Stage: Proving Your Business Model Works (CLV > CAC)
(6) Lean Analytics Stage 5: Scale — How to Know If Your Business Can Survive Market Pressure
(7) The Complete Lean Analytics Checklist: Diagnose Your Stage from Empathy to Scale