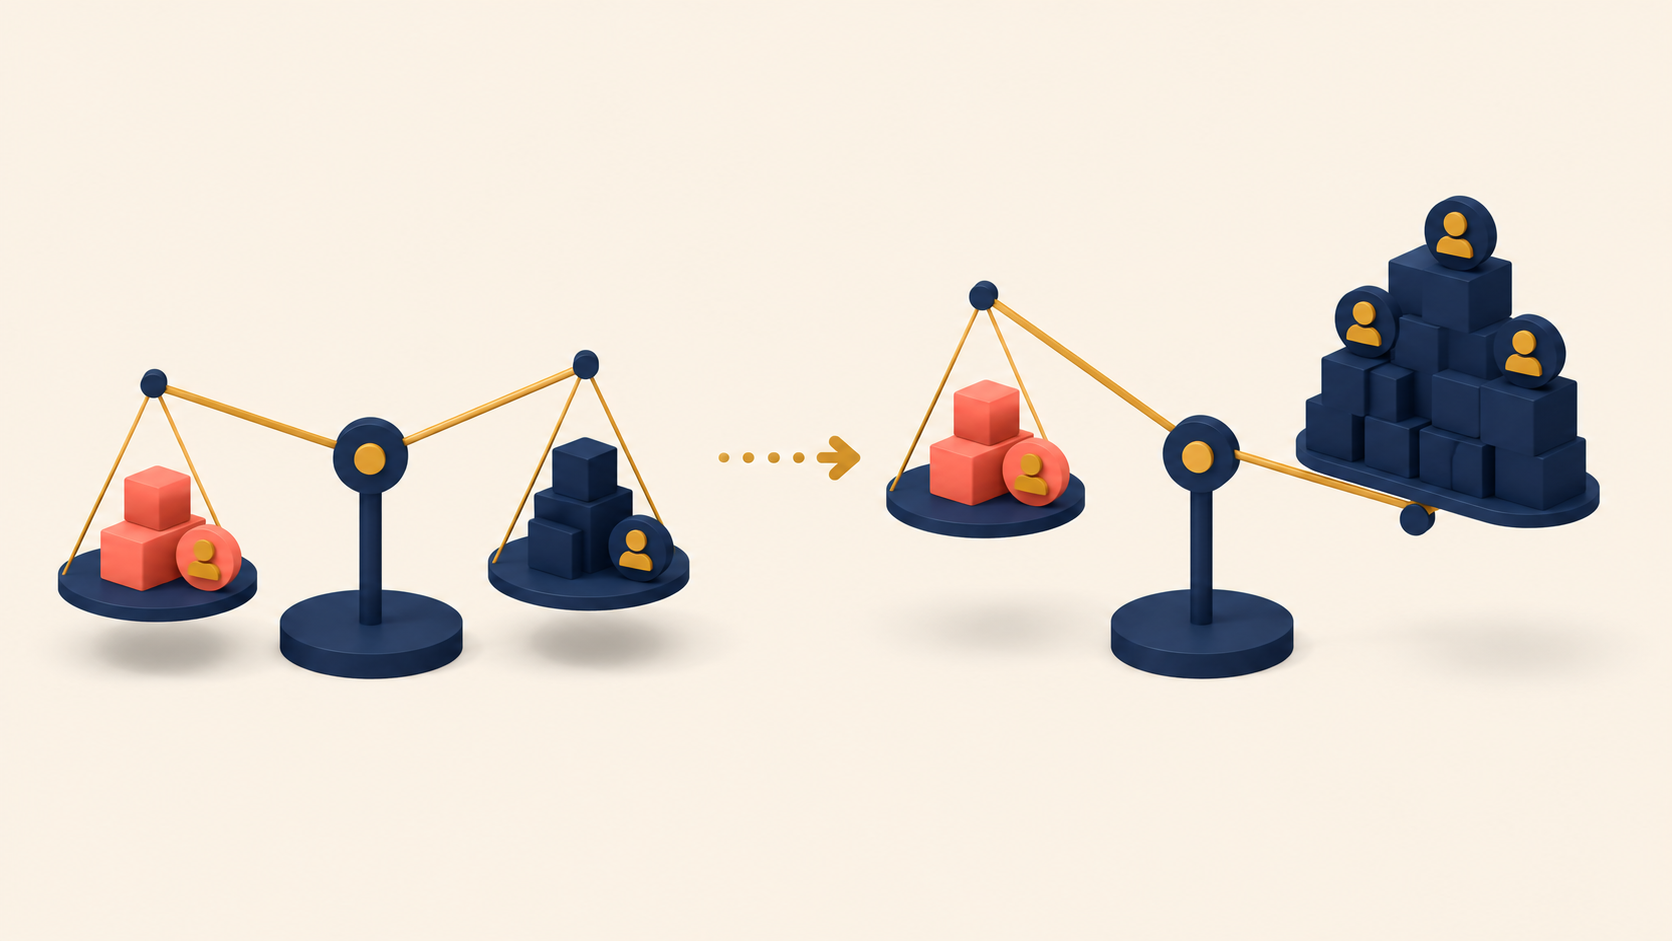
The Revenue stage in lean analytics is not about squeezing users. It is the moment a team stops asking “Does anyone value this product?” and starts asking “Does that value survive contact with money?” Across the first three lean analytics stages — Empathy, Stickiness, and Virality — the team iterates on the product itself. In the Revenue stage, the unit under test changes. The product steps back, and the business model takes the stand.
Two questions decide the verdict. First, does a single customer return more value than the cost of acquiring them — the CLV > CAC inequality that drives every customer lifetime value calculation. Second, does the business turn each marketing dollar into more recurring revenue than it consumes? Both questions matter because scaling a broken business model does not fix it. Scaling a broken business model amplifies the loss.
The Revenue stage tests four things: what it really proves, why CLV must exceed CAC, how to read the revenue efficiency ratio, and how three different break-even lenses tell a team whether the model is alive, healthy, or genuinely independent.
What the Revenue Stage Really Tests: Business Model, Not Product
The Revenue stage proves the business itself works. The goal here is not to maximize profit. The goal is to show that the business is viable at all. Three specific claims have to hold before a team moves on:
- The product can earn money. Conversion exists.
- The product can earn money repeatedly. Customers stay paying after the first transaction.
- The business model improves as it grows. Scale does not enlarge the loss.
This is why Revenue sits before Scale in the lean analytics stages. A broken business model does not heal at higher volume. Growth amplifies the damage, and the team ends up paying more to acquire customers it cannot retain.
The shift from product testing to business model testing changes what the team iterates on. In the Empathy, Stickiness, and Virality stages, the team reshapes the product to find and confirm user value. In the Revenue stage, the team iterates on revenue paths instead:
- Who pays
- When they pay
- What they pay for
- Under what conditions they stop paying
Each of these is its own experiment. A feature that fails to move a north star metric gets cut. A revenue path that fails to produce repeatable, scalable, sustainable income deserves the same treatment. The discipline is the same one the earlier stages teach — drop what does not work — applied to the monetization layer instead of the product layer.
The earlier stages ask, “Is this a product people value?” The Revenue stage asks a different question entirely: “Is this a viable business?” These are not the same question, and answering one does not answer the other. A product can be loved and still bankrupt the company that sells it.
Business Health Metric #1: Why CLV Must Exceed CAC
The Revenue stage hinges on a single inequality:
Customer Lifetime Value (CLV) > Customer Acquisition Cost (CAC)
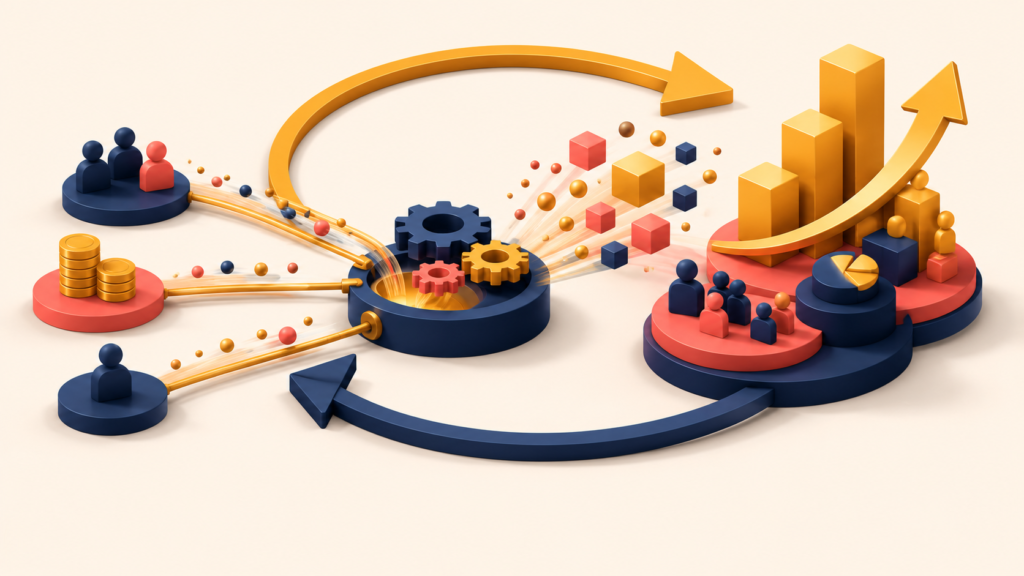
This inequality decides whether growth creates value or destroys it. CLV measures the revenue a single customer produces over the entire relationship. CAC measures what the company spends to acquire that customer. If CLV does not exceed CAC, the business is structurally broken — and every new customer makes it worse.
When CLV ≤ CAC, the business behaves like a machine that consumes more than it returns:
- Money goes in
- Less money comes out
- The harder the company pushes, the wider the gap
Three early symptoms follow. Each new customer increases the loss instead of offsetting it. Marketing efficiency degrades over time as the company chases worse-fit users. Fundraising shifts from unit economics to storytelling, because the math no longer carries the pitch.
This is also why a healthy-looking top line can hide a sick business. Growing user counts, rising engagement, and even rising revenue can coexist with a broken CLV-to-CAC ratio. A team focused on actionable metrics has to look past surface growth and at the underlying customer lifetime value calculation. Without that, scaling only buys more loss.
When the inequality fails, the cause is usually one of three things:
- Early churn is high. Users convert, but they leave before the product captures enough value to repay acquisition cost.
- Value and price are mismatched. Users feel the value but not at the price the company is charging.
- Acquisition quality is weak. The company is spending to bring in users who were never the right fit.
Each of these has a different fix. Early churn points back to Stickiness — the previous stage. Value-price mismatch points to pricing experiments and packaging. Weak acquisition quality points to channel and targeting. Diagnosing which one is driving CLV ≤ CAC is part of the Revenue-stage work, and tools like HubSpot’s CLV guide give a useful baseline for the calculation itself.
Business Health Metric #2: The Revenue Efficiency Ratio
Conversion rate and CLV both measure individual events. The Revenue stage needs one more answer — a question about the system as a whole:
Does the business get healthier the more money it spends to grow?
A practical ratio frames this directly:
(A − B) / C > 0.75
Where:
- A = recurring revenue this quarter
- B = recurring revenue last quarter
- C = sales and marketing spend last quarter
The ratio compares how much new recurring revenue the business generates against how much it spent to generate that growth. Reading it is straightforward:
- At or above 0.75: The business is converting growth spend into recurring revenue efficiently. The machine returns more value than it consumes.
- Below 0.75: Growth spend produces diminishing returns. The business is effectively spending more and getting less back.
A persistently low ratio is a structural signal, not a seasonal one. Quarterly noise is normal. A trend stuck below 0.75 quarter after quarter points at the business model itself, not at execution. The mechanics rhyme with the CLV > CAC failure mode:
- Money goes in
- Less money comes out
- The harder the company pushes for growth, the wider the gap
The reason this ratio earns its place in the Revenue stage is that it catches problems CLV alone misses. A business can have acceptable CLV on existing customers but still spend inefficiently to grow. The efficiency ratio surfaces that gap before scale makes it permanent.
Three Lenses on Break-Even: Customer Payback, Operational, and Ramen Profitability
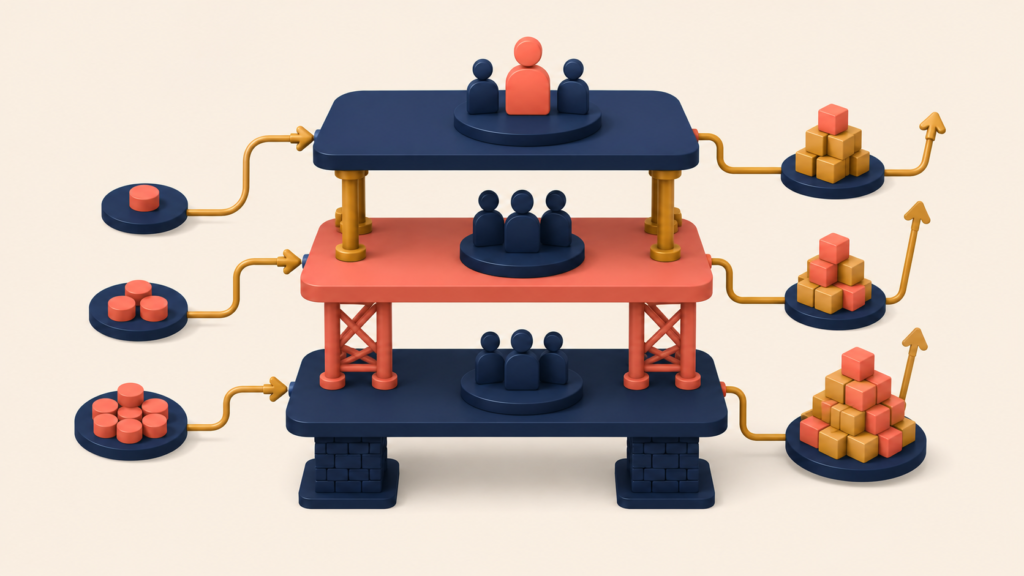
Break-even is not a single number. It is three different questions, and a healthy business answers all three.
Customer Payback Break-Even
How long does it take a single customer to pay back the cost of acquiring them? Shorter payback periods free up cash sooner, which means the company can reinvest in growth without raising more capital. A payback measured in months frees the business to push acquisition spend; a payback that stretches across years ties the company to investor patience.
Operational Break-Even
Does revenue cover ongoing operating costs? This is the traditional break-even most teams know. It is the line between a business that funds itself month to month and one that depends on external capital to keep the lights on. Investors look at this number because it tells them how long the runway needs to be.
Minimum-Survival (Ramen) Break-Even
If growth stopped tomorrow, could the business survive? This is sometimes called Ramen Profitability, a term Paul Graham coined for earning just enough to cover the founders’ living costs, no more. The metric is especially useful for bootstrapped teams that want to stay independent of investor timelines. Reaching Ramen Profitability does not signal that the business has won. It signals that the business has earned the right to choose its own pace.
Each lens answers a different question:
- Customer Payback answers, “How fast can we recycle growth capital?”
- Operational answers, “Can we sustain the business at its current size?”
- Ramen answers, “Can we exist without outside funding if we have to?”
A healthy Revenue-stage business understands where it stands on all three. Optimizing only for one — usually operational — hides risk in the other two. A team that hits operational break-even but ignores customer payback ends up cash-starved during growth pushes. A team that obsesses over operational break-even but cannot reach Ramen Profitability stays dependent on the next funding round forever.
Conclusion
The Revenue stage is the line between a product people value and a business that can survive on its own. Two checks decide whether the line has been crossed. CLV must exceed CAC, or growth destroys value instead of creating it. The revenue efficiency ratio must clear 0.75, or growth spend produces diminishing returns. Three break-even lenses then tell the team whether the business is healthy at its current size, healthy enough to recycle growth capital, and independent enough to survive without external funding.
The core message of this stage is direct: until CLV exceeds CAC, scaling only enlarges the loss. The next stage — Scale — tests whether the proven business model holds up under market conditions and real-world pressure. If the Revenue stage passes, the model is alive. The Scale stage decides whether it can grow.
Lean Analytics Series
(1) What is Lean Analytics? The Real Meaning of Lean and Why Experimentation Is at Its Core
(2) Lean Analytics Empathy Stage: How to Find Real Market Problems Worth Solving
(3) Lean Analytics Stickiness Stage: Measuring Retention and Engagement
(4) Viral Growth in Lean Analytics: How Users Bring Other Users (Coefficient, Cycle Time, B2B)
(5) Lean Analytics Revenue Stage: Proving Your Business Model Works (CLV > CAC)
(6) Lean Analytics Stage 5: Scale — How to Know If Your Business Can Survive Market Pressure
(7) The Complete Lean Analytics Checklist: Diagnose Your Stage from Empathy to Scale