
Strategy starts with a single question: where will we compete? Picking a market is not the same as picking an industry. It is a deliberate choice about the stage where our strengths can stand out, the customers we will serve there, and the slice of the opportunity we will pursue. Market segmentation is the discipline of making that choice concrete enough to guide every later decision — what to build, how to message it, which channels to invest in, and which to ignore.
Most weak strategies fail here. Teams define their market so broadly that no choice has actually been made, or they describe their market in the same language a competitor would use. Neither helps. A market definition only earns its keep when it narrows the field enough to change behavior. What follows covers the dimensions of that choice, the common mistakes, the two approaches to market sizing, and the practical ways to research a market without a million-dollar industry report.
What is Market Segmentation? The Seven Dimensions of Market Choice

Market segmentation is a set of decisions across multiple dimensions, not a single label. Picking “the SaaS market” is a category, not a strategy. A real market definition resolves seven questions at once.
| Dimension | The question to answer |
|---|---|
| Industry | Which industry will we operate in? |
| Market segment | Which specific segment within that industry will we focus on? |
| Geography | Which region, country, or locality will we serve? |
| Product or service category | What type of product or service will we offer? |
| Customer segment | Which specific type of customer will we serve? |
| Channel | How will we reach and serve those customers? |
| Value chain position | Where in the production or delivery process will we operate? |
Each dimension narrows the field. A company that answers all seven has made a strategic choice. A company that leaves three or four dimensions vague has not yet decided what game it is playing. The exercise exists to put scarce resources — engineering hours, marketing budget, leadership attention — somewhere defensible instead of everywhere thin.
A useful test: read the seven answers back to a colleague who has not seen the business. If they can describe what the company does not do, the definition is working. If everything still feels possible, the choices are still too soft.
Two Common Mistakes in Defining Your Market
Two failures show up over and over when teams define their market. Both feel safe in the moment, and both make the strategy weaker.
Defining the market too broadly. “Companies that need software” or “anyone who uses a mobile app” is not a market definition. It is a refusal to choose. A broad definition feels like it preserves optionality, but it removes the criteria needed to make product, marketing, and hiring decisions. Compare the two columns below:
| Too broad | More strategic |
|---|---|
| “Small and medium businesses” | “Service-based small businesses under three years old, with five to twenty employees” |
| “Healthcare” | “Outpatient specialty clinics struggling with patient scheduling and no-shows” |
| “E-commerce” | “Direct-to-consumer brands selling products over $100 that require customer education” |
The right-hand column tells the team what to build, who to call, and which competitor reviews to read. The left-hand column tells them nothing.
Choosing the same battleground as every competitor. If our market description sounds identical to a competitor’s, we have not defined a strategic position. We have agreed to fight on terrain where someone else already has the advantage. The goal is to find a stage where our specific capabilities create disproportionate value — which is almost always narrower and more specific than the territory we feel comfortable claiming.
Market Sizing: Top-Down vs Bottom-Up Approaches
Market sizing answers whether the opportunity is worth pursuing, and it also separates strategy conversations (“is this a real business?”) from execution conversations (“what can we actually sell next year?”). Two approaches dominate, and each one is useful for a different question.
| Item | Top-down approach | Bottom-up approach |
|---|---|---|
| Starting point | Total market size | Reachable customers |
| Core question | How large is this market overall? | How much can we realistically sell? |
| Typical steps | Total market → target segment → estimated share | Target customers → reachable users → conversion rate → revenue |
| Output | Long-term revenue potential | Short-term realistic revenue |
| Primary use | Market framing, investor conversations | Product and go-to-market planning |
| Main strength | Fast and intuitive | Grounded in execution reality |
| Main weakness | Heavily dependent on assumptions | Requires more detailed research |
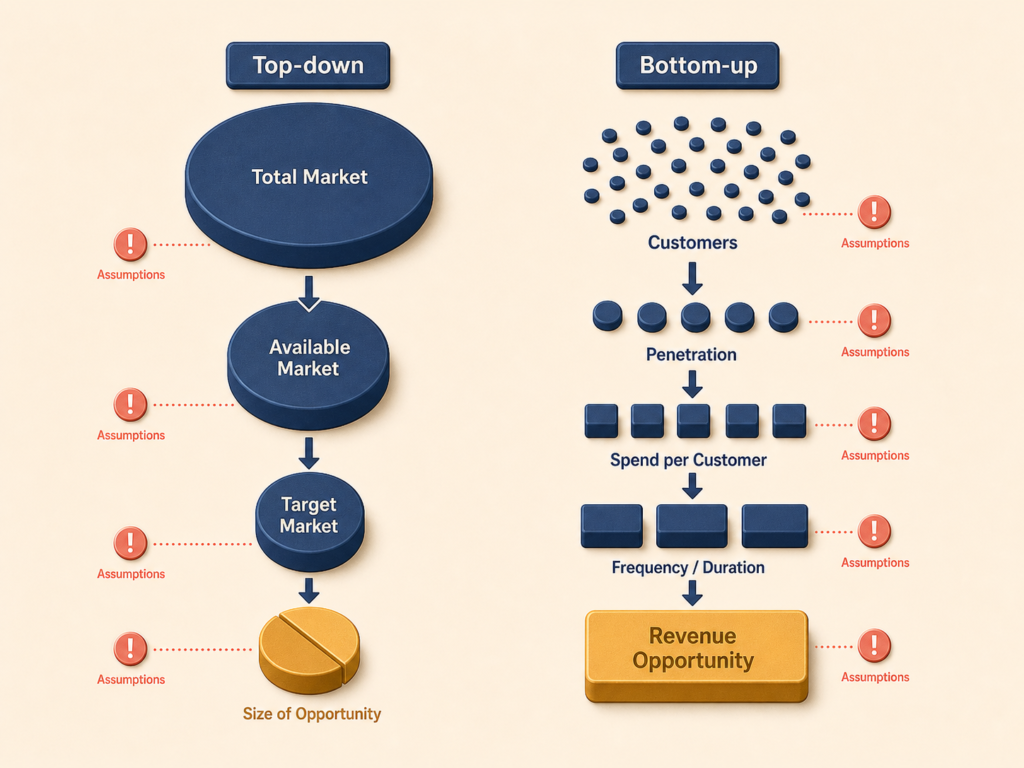
The top-down approach
The top-down approach starts with the total market and narrows toward our potential share. We identify the overall market size (typically from industry reports or analyst estimates), estimate the share we could realistically capture, and calculate potential revenue.
For example, if the project management software market is $7 billion, the creative agency segment is roughly 15% of that ($1.05 billion), and a new entrant could realistically capture 3% over five years, the calculation lands around $31.5 million. The math is quick and good for early feasibility checks. The weakness is that it leans heavily on the share assumption and ignores how we would actually reach and convert customers.
The bottom-up approach
The bottom-up approach starts from the customers we can actually reach and convert. We estimate the number of reachable potential customers, model a realistic conversion rate from comparable products or early data, and estimate revenue per customer.
For example: if the target customer is creative agencies of 10 to 50 people, there are 25,000 of them in our target geography, our channels can reach 8,000 of them, and the realistic conversion rate is 4%, we get 320 customers. At an average annual contract value of $12,000, year-one realistic revenue is roughly $3.84 million. Bottom-up sizing is closer to operational reality and forces concrete thinking about go-to-market mechanics. The trade-off is that it requires more research and can undersell long-term potential as channels scale.
Use both. Top-down gives the strategic frame and the investor narrative. Bottom-up gives the operating plan.
TAM, SAM, SOM Framework Explained
The TAM, SAM, SOM framework is the standard vocabulary for talking about market sizing at different layers. Each layer answers a different question, and confusing them is one of the most common mistakes in strategy decks.
| Term | Definition | Meaning |
|---|---|---|
| TAM (Total Addressable Market) | Total revenue opportunity at 100% market share | Theoretical ceiling. Useful for understanding industry scale |
| SAM (Serviceable Available Market) | The portion of TAM the product can actually serve | The relevant market given current capabilities and geographic focus |
| SOM (Serviceable Obtainable Market) | The portion of SAM we can realistically capture | Realistic short-term opportunity, accounting for competition and go-to-market constraints |
The relationship is nested:
┌─────────────────────────────────────────────┐
│                    TAM                      │
│   ┌─────────────────────────────────────┐   │
│   │                SAM                  │   │
│   │   ┌─────────────────────────────┐   │   │
│   │   │            SOM              │   │   │
│   │   └─────────────────────────────┘   │   │
│   └─────────────────────────────────────┘   │
└─────────────────────────────────────────────┘
TAM is the largest number on the slide. It exists to communicate that the industry is big enough to matter. Investors look at TAM to understand upside potential — is this a billion-dollar opportunity or a $50 million one? SAM narrows TAM by what the product can actually deliver today: it strips out the geographies we do not serve, the customer types our product cannot handle, and the use cases outside our scope. SOM is the operating number. It accounts for competition, our sales motion, and our channel reach over a realistic timeframe — usually the next one to three years.
Investors want to see TAM because it tells them how large the company could become. Operators should plan around SOM because it tells them what they can actually deliver. A strategy that uses TAM as the operating target is a strategy that will overhire, overcommit, and miss its plan.
How to Research a Market: Four Practical Methods
Market sizing needs data, and most teams do not have a research budget to commission custom studies. Four methods do most of the work and combine into a defensible estimate.
Industry reports and analyst research
Reports from firms like Gartner, Forrester, and IBISWorld give credible top-down market sizes. Search for “[industry name] market size report” or “[industry name] market trends.” Industry associations often publish similar data for free or at a much lower price than the major analyst firms. These sources are best for the top-down number and for framing the industry narrative.
Traffic and usage estimation tools
Tools like SimilarWeb and SEMrush estimate competitors’ web traffic, and app analytics platforms provide download and usage estimates for mobile products. The numbers are approximate, but they give a useful sense of competitor scale and overall market activity. If a leading competitor in a segment has only 50,000 monthly visitors, the segment is probably smaller than the analyst report suggests.
Keyword research
Search volume for related queries is a direct proxy for market interest. Tools like Google Keyword Planner, Ahrefs, and SEMrush surface this data, and tracking search interest over time reveals which markets are growing and which are shrinking. A market where the core problem queries have grown 40% year over year is fundamentally different from one where they have flatlined.
Customer development conversations
Talking to prospective customers is the only way to validate the numbers. Ask what they currently spend in the category, which alternatives they considered, and what budget exists for the problem. Even ten conversations produce field data that sharpens top-down estimates and exposes whether the willingness to pay is real. This is also the only method that catches the worst kind of sizing error — a market that looks large on paper but where no one is actually trying to solve the problem.
Combine the four. Industry reports give the upper bound, traffic and keyword data give the trend and competitive scale, and customer conversations give the reality check. Triangulating across them is more defensible than any single source.
Conclusion
Defining a market is not a paragraph at the top of a strategy deck. It is a set of seven explicit choices that constrain everything that follows, and it pairs with a sizing exercise that distinguishes the long-term opportunity from the short-term operating plan. Done well, market segmentation tells the team what it will build, who it will serve, and what it will deliberately not do. Done poorly, it produces a one-line description that sounds the same as every competitor’s and gives the team no real guidance.
The next article in this strategy playbook series tackles what comes after the market is defined: understanding the competitive landscape inside it. Most teams get this wrong by either claiming they have no competitors or by focusing only on the direct ones. The next piece covers how to find known, hidden, and substitute competitors — and how each type calls for a different strategic response.