
Most product teams that work in startups or modern product orgs run into the word “Lean” constantly. Lean Startup, Lean UX, Lean Analytics. Yet very few teams can clearly explain what Lean Analytics actually is, or why it is not just another dashboard framework — it is a methodology built around experimentation.
This is the first article in a series that walks through the entire Lean Analytics framework, stage by stage. It covers where Lean Analytics came from, what “Lean” actually means, and why structured experimentation sits at its core.
What is Lean Analytics: Why It Starts with Stages, Not Ideas
Most product teams do not fail from a shortage of ideas. They fail because they answer the wrong question at the wrong time.
In the earliest stage of a product, explosive growth is not the priority. What matters is whether the problem the business is trying to solve actually exists in the market. Only after that question is answered do other priorities start to matter:
- Are users coming back on their own?
- Are they telling people around them about the product?
- Are they willing to pay?
- Can the business model scale without breaking?
Lean Analytics provides a simple but powerful lens for sorting these questions into order. Its core premise is straightforward:
Every product passes through distinct stages, and each stage has a different thing it must prove.
At any moment, three questions matter most:
- What is the single most important question right now?
- Which metric tells us we are ready to move to the next stage?
- Which risk outweighs every other risk?
Lean Analytics is, at its core, a framework for matching the right question to the right stage — and the right metric to that question.
The Real Meaning of Lean: From Toyota Production System to Product Teams
When people hear the word “Lean,” they often think of speed:
- Shipping constantly
- Cutting process
- Sprinting without pause
But Lean did not start as a philosophy of speed. It started as a philosophy about waste.
The Origin of Lean: The Toyota Production System (TPS)
Lean traces back to the Toyota Production System (TPS), which Toyota began developing in earnest after World War II. The major advances happened from the 1950s through the 1970s.
TPS focused on eliminating three things:
- Waste (muda)
- Inconsistency (mura)
- Overburden (muri)
Of the three, eliminating waste was treated as the most critical task. Toyota catalogued many types of waste, but the most destructive were overproduction and excess inventory:
- Cars that did not sell
- Raw materials sitting unused
- Idle machines
In other words, the real problem was resources poured into places that produced no value.
The core idea was radical for its time, yet simple:
Produce only what is needed, when it is needed, in the amount that is needed.
This “Just-in-Time” mindset was not about moving faster. It was about not committing resources before demand was confirmed.
The Toyota Way: Why Continuous Improvement Matters
Alongside TPS, Toyota emphasized a set of principles that later became known as The Toyota Way. Two of them stand out:
- Continuous improvement (kaizen)
- Decisions grounded in reality
One concept here is especially important: Genchi Genbutsu, often translated as “Go and See.” Rather than relying on reports or organizational hierarchy, teams were expected to:
- Observe the actual process
- Talk to the people doing the work
- Improve from the bottom up
Learning happens where reality lives, not where opinions are loudest.
How Lean Spread, and How It Got Misunderstood
In the 1970s and 1980s, American manufacturers began studying and adopting Toyota’s approach. The term “Lean” was coined in 1988 by John Krafcik, and it spread widely after the 1990 book The Machine That Changed the World by James Womack and his colleagues.
In manufacturing, Lean worked best in environments where:
- Demand was reasonably predictable
- Products were mature
- Optimization mattered more than exploration
For that reason, Lean often looked sequential in practice:
- A long research phase
- Careful planning
- Controlled execution
Then Lean crossed over into startups and product teams. The tools stayed the same, but the context changed completely. Now the environment looked like this:
- Demand was uncertain
- Products were unfinished
- Learning mattered more than optimization
The misunderstanding starts here.
What Lean Analytics Means for Product Teams
Lean does not mean “move fast everywhere.” It means concentrate effort where it reduces the largest risk.
In practice, this looks like:
- Moving fast toward learning
- Slowing down where speed would cause expensive mistakes
- Deciding deliberately what to measure and why
A useful mental model:
Lean is not about doing everything fast. It is about doing fewer things, deliberately.
When a team is busy but the learning is unclear, the team is spending time, energy, and money on motion rather than progress.
The Five Stages of Lean Analytics

This is the framework used throughout the rest of the series. Each stage has one dominant question:
| Stage | Core Question |
|---|---|
| Stage 1: Empathy | Do people care about this problem enough to change behavior? |
| Stage 2: Stickiness | Do they keep using it in real life? |
| Stage 3: Virality | Do they naturally bring other people in? |
| Stage 4: Revenue | Do they pay in a sustainable way? |
| Stage 5: Scale | Can the model grow across channels and markets without breaking? |
A common failure pattern is to try to “skip” a stage. Some examples:
- Pushing paid marketing before retention stabilizes
- Designing complex pricing before users feel the value
- Expanding channels before the unit economics of the model are understood
The goal is not to “reach the Scale stage.” The goal is to earn the next stage.
Each stage is a gate. You pass through it with evidence, not with intuition or optimism.
The Core of Lean Analytics: Structured Experimentation
One principle runs through all five stages of Lean Analytics:
Progress happens only through experimentation.
But “experimentation” in Lean Analytics does not mean random testing or endless A/B tests. It means structured comparisons designed to reduce uncertainty.
Every experiment centers on one question:
“Compared to what?”
To answer that question rigorously, Lean Analytics relies on three closely linked ideas:
- Segmentation
- Time
- Controlled Comparison
Longitudinal vs Cross-Sectional Study: When to Use Each
Not every experiment observes change in the same way. Lean Analytics depends on two fundamentally different research perspectives.
| Dimension | Longitudinal Study | Cross-Sectional Study |
|---|---|---|
| Core idea | Observe the same group across different points in time | Compare different groups at the same point in time |
| Question it answers | “How is behavior changing?” | “What made the difference?” |
| Typical method | Cohort analysis | A/B testing |
| Time perspective | Time-based (weeks, months) | Snapshot (same period) |
| Strength | Captures trends, lifecycle effects, long-term impact | Fast, cost-efficient, isolates causal effect |
| Main limitation | Slow feedback, high time cost | Cannot explain durability or long-term change |
| Best used for | Stickiness, retention, revenue durability | Copy, flow, UI, pricing comparisons |
| Risk if used alone | Slow learning, unclear causality | Short-term optimization trap |
| Role in Lean Analytics | Confirms whether change lasts | Confirms which change worked |
Longitudinal and cross-sectional analyses answer different questions:
- Longitudinal analysis (cohorts) describes how behavior changes over time, and whether changes last. It is essential for understanding stickiness, retention, and revenue durability.
- Cross-sectional analysis (A/B testing) explains what made the difference at a specific point in time. It is faster, cheaper, and better at isolating causal effects.
Lean Analytics works because it uses both lenses together — observing behavior across time, running parallel experiments on changes, and interpreting results in context.
Segmentation: The Foundation of Effective Experimentation
Every experiment begins with deciding who to group together.
A segment is a group of users that share meaningful similarities:
- Behavior
- Context
- Constraints
Segmentation turns a vague aggregate of “all users” into groups that can be compared. For example:
- Users who completed onboarding vs users who did not
- Teams that integrated other tools vs solo users
- Customers acquired through sales vs self-serve customers
Without segmentation, averages mislead. Signals cancel each other out, and the team ends up optimizing for no one in particular.
Looking at a global average without segmenting is like averaging the test scores of elementary school students and graduate students to discuss the “average education level.” The number exists, but no meaningful conclusion can come from it.
Cohort Analysis: Tracking User Behavior Over Time
Segmentation alone is not enough. Products change, markets change, and users who signed up at different times experience different realities.
This is where cohort analysis comes in.
A cohort is a group of similar users observed across time:
- Users who signed up in the same week
- Customers who went through the same onboarding flow
Cohort analysis answers questions that averages cannot:
- Are recently signed-up users retaining better or worse than earlier ones?
- Did this change improve long-term behavior, or only create a short-term spike?
- Is growth hiding churn?
This is the longitudinal view — tracking the flow of change rather than a snapshot.
In Lean Analytics, cohort analysis is essential for:
- Stickiness
- Revenue
- Understanding lifecycle effects
A/B Testing, Multivariate Testing, and the Lean Analytics Experimentation Loop
If cohort analysis answers “how have things changed?”, A/B testing answers “what made the difference?”
A/B testing compares variants at the same point in time:
- Copy
- Flow
- Pricing page
- Onboarding steps
The rules are simple:
- Change only one variable
- Define success clearly
- Run it long enough to be meaningful
This is the cross-sectional view — different groups, same point in time.
When a product becomes more complex and interactions matter more, multivariate testing helps explore several variables at once. But it only works after the basic elements have stabilized.
The Lean Analytics Experimentation Loop: From Hypothesis to Decision
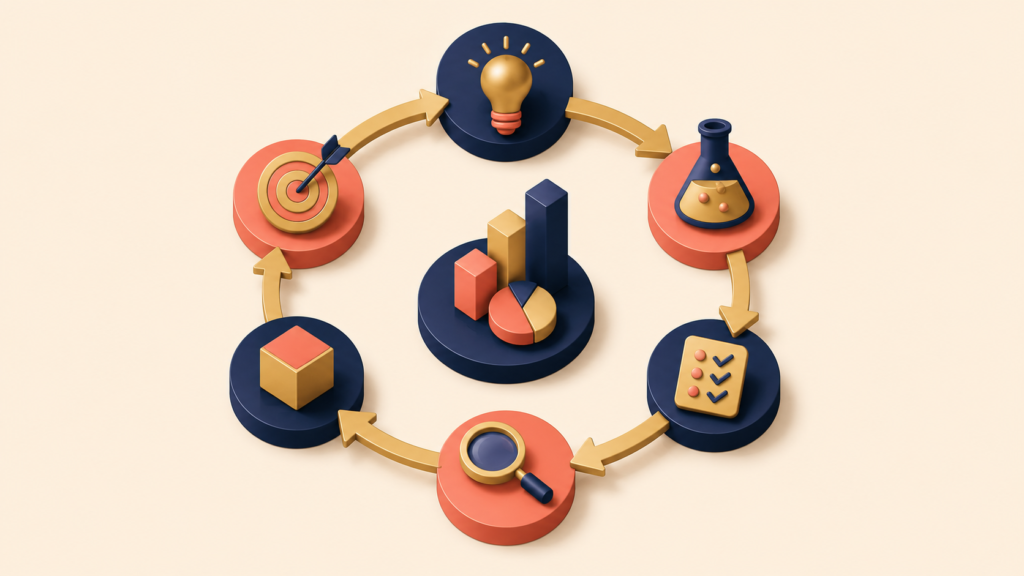
Lean Analytics is not a collection of techniques. It is a single cycle:
1. Define the current goal and the KPI that represents success
2. Segment users to decide who to learn from
3. Form a hypothesis that could move the KPI
4. Test it with cohorts, A/B tests, or multivariate experiments
5. Measure impact across time
6. Decide: double down / adjust / pivot / stop
→ Repeat with sharper assumptions
This is why experimentation is the heart of Lean Analytics. Every step feeds the next decision.
Data-Driven vs Data-Informed: Why Optimization Alone Cannot Drive Innovation
Lean Analytics is powerful, and that is exactly why it can be dangerous when used poorly.
The core risk is confusing data-driven decisions with good decisions.
There are two types of data-based decision-making:
- Data-driven: data alone determines the decision
- Data-informed: data is one of several inputs the team weighs
Lean Analytics works best in the second mode. Data-driven decisions work well when the problem is already well-defined:
- Local optimization
- Incremental improvement
- Tuning an existing flow
But the limits appear quickly when a team tries to:
- Enter a new market
- Make a strategic bet
- Set long-term direction
Analysis is excellent at telling you which option is better. It is much weaker at telling you which options are worth exploring at all. That judgment belongs to people.
A useful framing:
People form hypotheses. Data validates or refutes them.
Think of GPS navigation. The data can tell you “this route is ten minutes faster.” It cannot tell you “where to go today.” Choosing the destination is a human decision; optimizing the route is the role of the data. Lean Analytics works the same way.
Why Optimization Alone Cannot Lead to Innovation
Relying only on data naturally biases a team toward optimization:
- Improving known behaviors
- Increasing efficiency
- Squeezing more value from the existing system
This is useful, but not enough. Optimization finds a better answer inside what is already known. Innovation questions whether what is known is still the right thing to be doing.
A team that optimizes only:
- Reduces risk
- Reduces imagination too
- Gets extremely good at the wrong thing
It does not fail loudly. It stagnates efficiently.
For that reason, Lean Analytics must always be grounded in:
- The current stage of the business
- A clearly stated question
- Explicit human judgment
Without these, data does not lead to insight. It quietly reinforces inertia.
Lean Analytics is not a tool for optimization alone. It is a methodology for responsible innovation:
- Form bold hypotheses
- Test them rigorously
- Learn faster without losing direction
When a team treats analysis not as the sole driver of decisions but as a means of validation, Lean Analytics moves beyond refining what already exists. It actively makes innovation possible.
Conclusion
Lean Analytics rests on two ideas that work together. The first is that every product passes through distinct stages, and each stage has a different question that must be answered with evidence. The second is that progress within any stage happens only through structured experimentation — segmentation, cohorts, and controlled comparisons that reduce uncertainty rather than confirm intuition.
Together, these two ideas turn Lean Analytics from a dashboard framework into a methodology. The point is not to collect more data. The point is to ask the right question at the right stage, run experiments that can actually answer it, and let human judgment decide what to do with what was learned.
The next article in this series looks at the first stage of Lean Analytics: Empathy. Empathy is the stage where teams confirm whether users actually care about the problem — and which uncertainties to reduce before building anything.
Lean Analytics Series
(1) What is Lean Analytics? The Real Meaning of Lean and Why Experimentation Is at Its Core
(2) Lean Analytics Empathy Stage: How to Find Real Market Problems Worth Solving
(3) Lean Analytics Stickiness Stage: Measuring Retention and Engagement
(4) Viral Growth in Lean Analytics: How Users Bring Other Users (Coefficient, Cycle Time, B2B)
(5) Lean Analytics Revenue Stage: Proving Your Business Model Works (CLV > CAC)
(6) Lean Analytics Stage 5: Scale — How to Know If Your Business Can Survive Market Pressure
(7) The Complete Lean Analytics Checklist: Diagnose Your Stage from Empathy to Scale